
Pseudoreplication#
A well of a few hundred cells is not a few hundred independent observations of a treatment. The cells share the well’s confluency, focus and plate position, so they carry the well’s nuisance shifts in common. Counting each cell as a replicate inflates the sample size by the cells-per-well factor and manufactures significance from noise.
Which measurements moved covers the aggregate route:
tl.differential_features refuses cell-level input and asks you to aggregate to wells first. This page is
about the other route, testing at cell resolution with tl.hit_calling and tl.distance, where the fix is
not to aggregate but to make the null resample whole wells. mt.metrics.diagnose_testing shows, on your own
screen, what the difference costs.
A screen where nothing is real#
We build a plate where no perturbation has any effect, so every hit is a false positive by construction. The wells still differ, but only through nuisance: a row and column gradient across the plate, and a confounder that ties some features to the well’s cell count. Any test that calls a hit here is wrong.
import warnings

import mantispy as mt

# Render warnings as their message alone; the kernel temp-file path in the default format is noise here.
warnings.formatwarning = lambda message, category, *args, **kwargs: f"{category.__name__}: {message}\n"

cells = mt.ds.synthetic_plate(
    n_plates=2,
    n_wells=48,
    n_cells=40,
    n_features=10,
    n_perturbations=11,
    effect_size=0.0,
    row_gradient=3.0,
    col_gradient=3.0,
    confounder_effect=3.0,
    seed=0,
)
cells
AnnData object with n_obs × n_vars = 3873 × 10
    obs: 'Metadata_Plate', 'Metadata_Well', 'Metadata_Row', 'Metadata_Col', 'Metadata_Perturbation', 'Metadata_Control', 'Metadata_Batch', 'Metadata_ImageNumber', 'Metadata_CellCount'
    var: 'object', 'feature_group', 'feature', 'channel', 'scale', 'angle', 'gray_levels', 'radial_bin', 'params', 'is_feature'
    uns: 'mantispy'
    layers: None (.X)
It is annotated at cell resolution, and each well holds tens of cells that share that well’s position on the plate.
from mantispy._core.schema import get_resolution

counts = cells.obs.groupby(["Metadata_Plate", "Metadata_Well"], observed=True).size()
print("resolution:", get_resolution(cells))
print("wells:", counts.size, "| median cells per well:", int(counts.median()))
resolution: cell
wells: 96 | median cells per well: 40
The nuisance is real even though the biology is not#
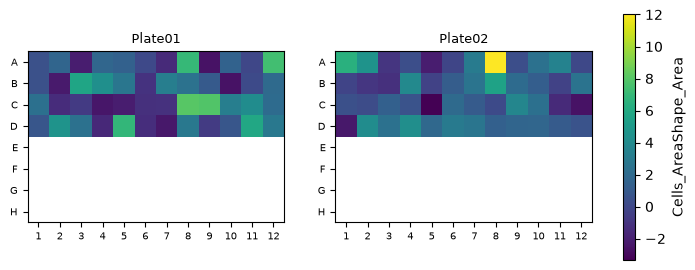
Read one feature across the plate. Its value drifts with row and column: neighbouring wells look alike and distant wells look different, for reasons that have nothing to do with any treatment. Every cell in a well inherits that well’s value, which is exactly why the cells are not independent.
mt.pl.plate(cells, color=cells.var_names[0])
What treating cells as replicates costs#
mt.metrics.diagnose_testing relabels control cells as pseudo-treatments of whole control wells, where the
truth is known to be null, and reports each hit caller’s false positive rate under two nulls side by side:
the cell-shuffle null, which permutes single cells and so treats them as independent replicates, and
the well-block null, which permutes whole wells, the unit the experiment actually randomized.
A calibrated test stays at or below the chance cutoff. Read the two rates against each other.
report = mt.metrics.diagnose_testing(cells, n_draws=8, n_permutations=50)
report
| check | value | expected | verdict | note | |
|---|---|---|---|---|---|
| 0 | hit_calling well-block null rate | 0 of 8 | <= 2 | pass | hit_calling called a control-only pseudo-treat... |
| 1 | hit_calling cell-shuffle null rate | 8 of 8 | <= 0 (well-block) | FAIL | the same hit_calling null permuting single cel... |
| 2 | edistance well-block null rate | 1 of 8 | <= 2 | pass | edistance called a control-only pseudo-treatme... |
| 3 | edistance cell-shuffle null rate | 8 of 8 | <= 1 (well-block) | FAIL | the same edistance null permuting single cells... |
import matplotlib.pyplot as plt
import numpy as np

rates = report[report["check"].str.endswith("null rate")].copy()
rates["caller"] = rates["check"].str.split().str[0]
rates["kind"] = np.where(rates["check"].str.contains("cell-shuffle"), "cell-shuffle", "well-block")
rates["rate"] = rates["value"].apply(lambda v: int(v.split()[0]) / int(v.split()[-1]))

callers = ["hit_calling", "edistance"]
x = np.arange(len(callers))
width = 0.38
fig, ax = plt.subplots(figsize=(5.5, 3.5))
for offset, kind in ((-0.5, "cell-shuffle"), (0.5, "well-block")):
    heights = [rates[(rates["caller"] == c) & (rates["kind"] == kind)]["rate"].iloc[0] for c in callers]
    ax.bar(x + offset * width, heights, width, label=kind)
ax.axhline(0.05, linestyle="--", color="grey", linewidth=1, label="nominal 0.05")
ax.set_xticks(x)
ax.set_xticklabels(callers)
ax.set_ylabel("false positive rate on a null screen")
ax.set_title("Counting cells as replicates inflates the false positive rate")
ax.legend()
plt.show()
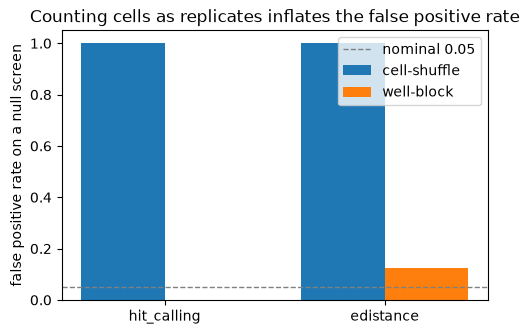
The tall cell-shuffle bars are the pitfall: counting cells as replicates makes pure noise look significant,
far above the nominal rate, and the verdict fails. The well-block bars, the rates to trust, sit near nominal.
The gap between the two is the pseudoreplication, measured on this screen rather than asserted. Each row of the
table names the block it draws whole and, for hit_calling, the method it measured, so the check describes the
test you mean to run.
The default already draws whole wells#
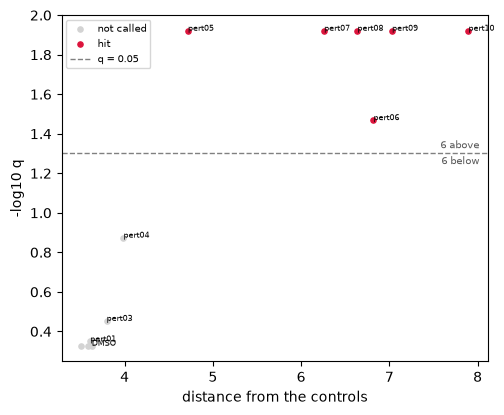
At cell resolution tl.hit_calling and tl.distance resample whole wells for their permutation null without
being asked, so the calibrated well-block rate above is what a plain call gives you. On this small screen the
caller goes further and warns that its null has few wells and is therefore only conservative, pointing to
tl.aggregate for an exact test: the tool says where it stands rather than returning a confident wrong
answer. On the null plate it calls nothing.
mt.tl.hit_calling(cells)
mt.pl.hits(cells)
The other route: aggregate first#
When the question is about the treatment rather than the cells, aggregate to the well with tl.aggregate and
test the wells with tl.differential_features, the pseudobulk approach single-cell settled on. The unit of
the test is then the unit that was randomized. That path is worked through in
Which measurements moved.
wells = mt.tl.aggregate(cells)
wells
AnnData object with n_obs × n_vars = 96 × 10
    obs: 'Metadata_Plate', 'Metadata_Well', 'Metadata_CellCount', 'Metadata_Row', 'Metadata_Col', 'Metadata_Perturbation', 'Metadata_Control', 'Metadata_Batch', 'Metadata_ImageNumber'
    var: 'object', 'feature_group', 'feature', 'channel', 'scale', 'angle', 'gray_levels', 'radial_bin', 'params', 'is_feature'
    uns: 'mantispy'
    layers: None (.X)
The same pitfall on a real screen#
The synthetic plate makes the point with strong, deliberate gradients. The effect is not an artifact of those
gradients. mt.ds.jump_cells is one real JUMP plate at single-cell resolution, with eight DMSO control wells
sitting at different positions on the plate. We take a slice of it for speed, relabel its control cells as
pseudo-treatments, and run the same check. The direction is the same as on the synthetic plate, though subtler,
because the wells of a single plate vary less than the gradients we injected above.
jump = mt.ds.jump_cells()
well = jump.obs["Metadata_Well"].astype(str).to_numpy()
# A slice for speed: up to 150 cells per well and the 120 highest-variance features.
rng = np.random.default_rng(0)
kept = np.concatenate(
    [rng.choice(np.where(well == w)[0], size=min(150, int((well == w).sum())), replace=False) for w in np.unique(well)]
)
jump = jump[np.sort(kept)].copy()
variance = np.asarray(jump.X).var(axis=0)
jump = jump[:, np.sort(np.argsort(variance)[::-1][:120])].copy()
jump
AnnData object with n_obs × n_vars = 3600 × 120
    obs: 'Metadata_ImageNumber', 'Metadata_ObjectNumber', 'Metadata_AbsPositionZ', 'Metadata_AbsTime', 'Metadata_BinningX', 'Metadata_BinningY', 'Metadata_ChannelID', 'Metadata_ChannelName', 'Metadata_Col', 'Metadata_ExposureTime', 'Metadata_FieldID', 'Metadata_ImageResolutionX', 'Metadata_ImageResolutionY', 'Metadata_ImageSizeX', 'Metadata_ImageSizeY', 'Metadata_MainEmissionWavelength', 'Metadata_MainExcitationWavelength', 'Metadata_MaxIntensity', 'Metadata_ObjectiveMagnification', 'Metadata_ObjectiveNA', 'Metadata_PlaneID', 'Metadata_Plate', 'Metadata_PositionX', 'Metadata_PositionY', 'Metadata_PositionZ', 'Metadata_Row', 'Metadata_Site', 'Metadata_Well', 'Metadata_Center_X', 'Metadata_Center_Y', 'Metadata_Source', 'Metadata_JCP2022', 'Metadata_InChIKey', 'Metadata_Perturbation', 'Metadata_Perturbation_Type', 'Metadata_Control'
    var: 'object', 'feature_group', 'feature', 'channel', 'scale', 'angle', 'gray_levels', 'radial_bin', 'params', 'is_feature', 'selected'
    uns: 'mantispy'
    layers: None (.X)
mt.metrics.diagnose_testing(jump, n_draws=8, n_permutations=100)
| check | value | expected | verdict | note | |
|---|---|---|---|---|---|
| 0 | hit_calling well-block null rate | 0 of 8 | <= 2 | pass | hit_calling called a control-only pseudo-treat... |
| 1 | hit_calling cell-shuffle null rate | 5 of 8 | <= 0 (well-block) | FAIL | the same hit_calling null permuting single cel... |
| 2 | edistance well-block null rate | 0 of 8 | <= 2 | pass | edistance called a control-only pseudo-treatme... |
| 3 | edistance cell-shuffle null rate | 2 of 8 | <= 0 (well-block) | pass | the same edistance null permuting single cells... |
The same signature appears on real data: hit_calling under the cell-shuffle null over-calls the control-only
pseudo-treatments and its verdict fails, while the well-block null stays clean. edistance shows the same
direction more mildly. The inflation is smaller than on the synthetic plate, as expected for one plate whose
wells differ only by real position and seeding rather than by a gradient we set, but the lesson holds: counting
cells as replicates manufactures significance, and the well-block null does not.
The tool carries a matching test (test_the_diagnostic_holds_on_a_real_pooled_screen) that pins this direction
on the cp-POSH optical pooled screen, so the behavior is checked on real data, not only shown here.
Takeaway#
Cells within a well are not independent replicates; the well, or the plate, is the unit that was randomized.
Testing at cell resolution is fine as long as the null resamples whole wells.
tl.hit_callingandtl.distancedo this by default.mt.metrics.diagnose_testingmeasures, on your own screen, whether the null is calibrated and what a cell-shuffle would cost, and names the exact method and block it checked.When the question is about the treatment, aggregate to wells with
tl.aggregateand test withtl.differential_features, which refuses cell-level input for this reason.